SnapFlood
Snap, upload, contribute. A photograph of a flooded street, with a location and a time, is a measurement — and it is the measurement India's flood record is missing.
It started as a hashtag
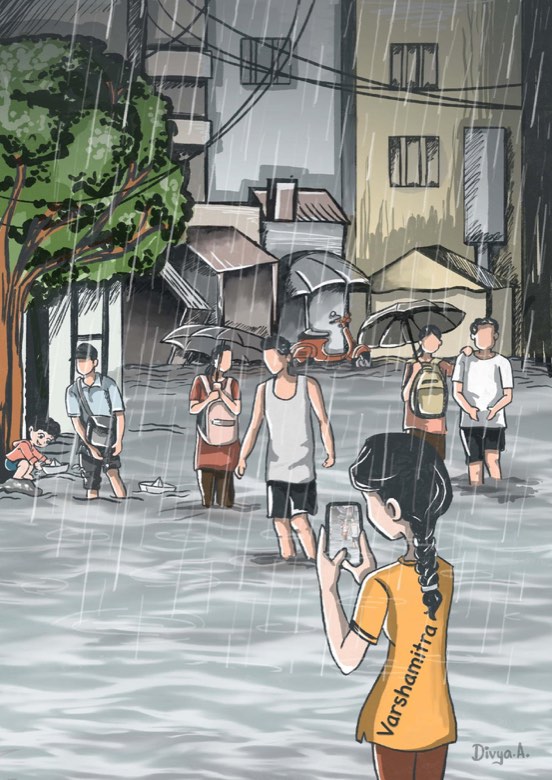
In 2023 my group ran a campaign called VarshaMitra, “friend of the rain”. It asked people in Hyderabad to tweet flooding while they were standing in it. The six-part ask was deliberate, because a photograph without a place and a depth is a picture, not data. We called the format a Sixer Tweet: one tweet, six tags.
- Tag 1
- City —
#Hyderabadrains#Hyderabadfloods - Tag 2
- Landmark — apartment or building name
- Tag 3
- Locality — colony or street name, e.g.
#Koti - Tag 4
- Water depth —
#kneewater#5cm - Tag 5
- Date —
#20072023 - Tag 6
- Time —
#0800
A tweet reading “railway bridge at Lingampally with full of water” tells you almost nothing: which bridge, how deep, at what hour? The same event tagged six ways gives a locality, a geolocation, a depth of five to six centimetres and a timestamp of 08:00 on 20 July 2023 — that is a row in a database.
Hyderabad has rain gauges, and the Musi has river gauges. What the record is missing is the street: how deep the water stood in Koti at 08:00, and whether the next colony was dry.
Twitter was never going to hold that record, so the campaign became an app: the same six questions, asked by a form instead of a hashtag, with the location taken from the phone. That is SnapFlood.
How it fits together
SnapFlood is one input to a larger system. The Urban Flood Information System joins what people on the street can see to what satellites, rain gauges and models produce, and puts the result in front of the agencies that have to act on it.
See how the whole system fits together on the RAFT page.